MAPS AND TABLES
Information about PDMPs operations or functions are collected, summarized, and displayed in an easy and concise format. Create your own reports on PDMP policies, procedures, and capabilities from TTAC’s online database for an interactive visualization experience. TTAC has built several data sets summarizing drug overdose rates; including prescription drugs, using data from CDC’s WONDER Database, an integrated information and communication for public health.
PDMP POLICIES AND CAPABILITIES
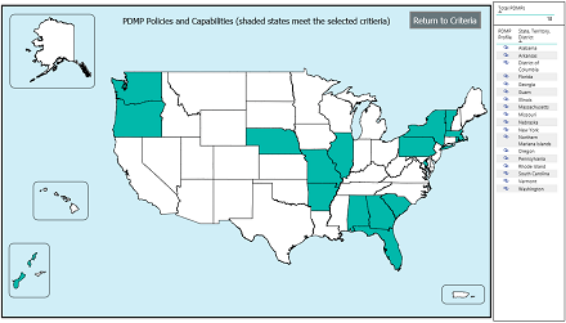
The Prescription Drug Monitoring Program Training and Technical Assistance Center (TTAC), with support from the Bureau of Justice Assistance (BJA), has conducted multiple State Assessments of prescription drug monitoring programs (PDMPs) since 2010. The assessments were completed by the PDMP Administrators and have data on PDMP statutes, regulations, policies and procedures.
As more PDMPs were implemented and new laws and practices were instituted, the TTAC assessments evolved to capture the changes, new practices and trends. The assessments have provided a picture of how PDMPs evolved over time. Historically, as new PDMPs were implemented they adopted the best practices and proven policies of established PDMPs, took advantage of newer technology, and addressed the needs of a wider group of stakeholders.
TTAC has compiled information from the assessments, legislative updates, and the PDMP Administrators. This visualization allows the user to view the policies and capabilities of PDMPs from 2010 to present.
*Information included on the TTAC website is obtained from state assessments, directly from the PDMP Administrators, and a review of statutory/regulatory updates. PDMP Administrators have the opportunity to verify and confirm the accuracy and completeness of the information prior to it being posted. PDMP statutes, regulations, policies, and procedures may have changed since this information was posted on the website and should always be verified by the appropriate PDMP Administrator.
TTAC VisualizationPDMP INTERSTATE PARTNERS
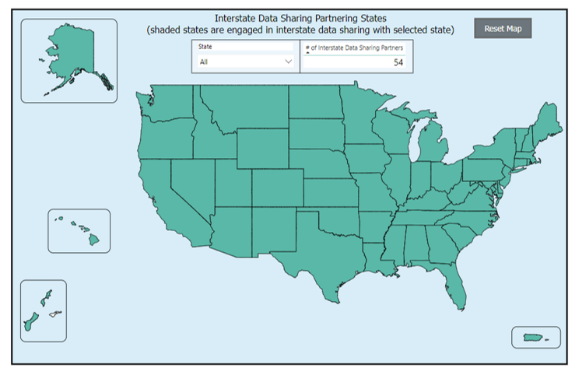
Graphic showing the states with which the selected state is currently engaged in interstate data sharing.
TTAC VisualizationOVERDOSE STATISTICS
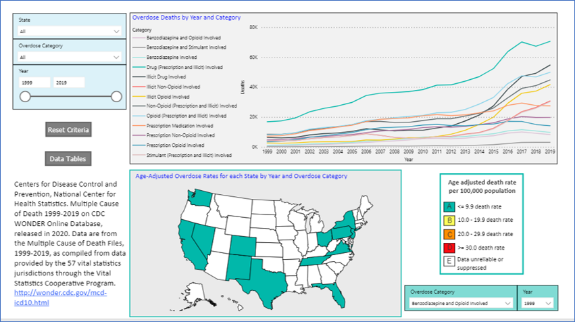
The Centers for Disease Control and Prevention, National Center for Health Statistics. Multiple Cause of Death 1999-2023 on CDC WONDER Online Database (released December 2025) is a compilation of data from the Multiple Cause of Death Files provided by the 57 vital statistics jurisdictions through the Vital Statistics Cooperative Program.
*Death rates based on counts of less than twenty (death count < 20) are flagged as "Unreliable". A death rate based on fewer than 20 deaths has a relative standard error (RSE(R)) of 23 percent or more. A RES(R) of 23 percent is considered statistically unreliable. Death counts and death rates are "Suppressed" when the figure represents zero to nine (0-9) persons.
Key terms:
Drug refers to prescription, illicit, and unspecified drugs.
Prescription drug refers to a pharmaceutical drug that requires a medical prescription to be dispensed; includes Schedule II - V controlled substances and legend drugs (i.e., amphetamines, barbiturates, opiates, antibiotics, statin drugs).
Illicit drug refers to a substance that is not allowed to be prescribed or possessed under Federal Law (i.e., opium, heroin, cocaine, cannabis, LSD).
TTAC Visualization